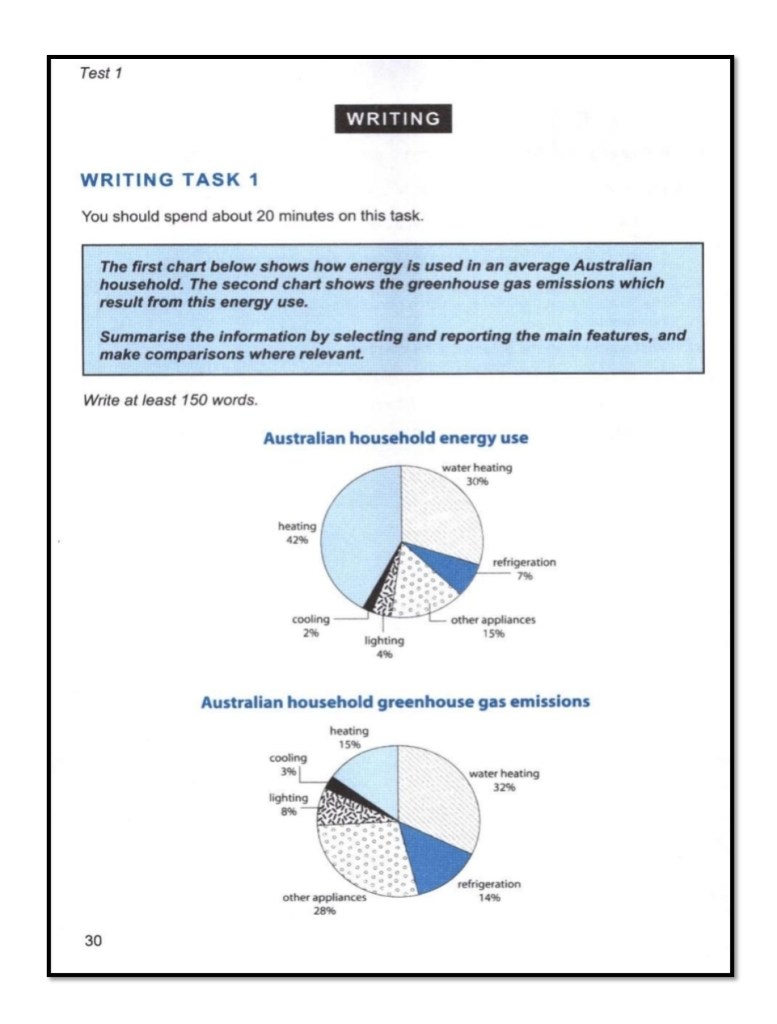
The first pie graph compares the proportions of energy consumed in some applications in an ordinary residence in Australia. The second one compares the percentages of the resultant greenhouse emissions.
In general, heating and water heating consume a majority of the total energy while the other uses have relatively small proportions. On the other hand, whereas water heating is a dominant category in terms of emissions, also, the other major category in this area is “other appliances.”
To begin with, heating and water heating consume 42% of and 30% of the total energy, respectively. Subsequently, other appliances consume 15% of the total. Furthermore, the energy proportions for refrigeration, lighting, and cooling are 7%, 4%, and 2%, respectively.
Further, 32% of and 28% of the emissions result from water heating and other appliances, respectively. The shares for heating and refrigeration are 15% and 14%, respectively. Finally, lighting leads to 8% of the emissions, and cooling causes 3% of them.
**************************