
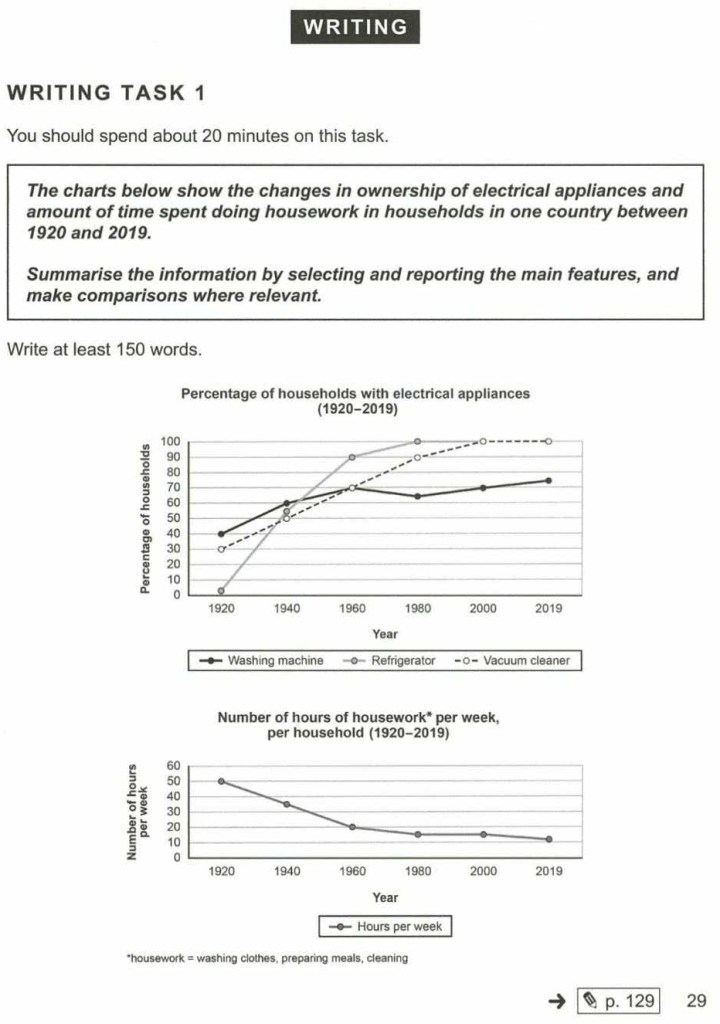
The first line graph illustrates the proportions of families that possessed electronic appliances in a nation from 1920 to 2019. The second one represents how many hours a week were devoted to some household chores in a family in the same region during the same time period.
In general, the shares of households with different devices increased by varying extents. The number of hours given to housework in a household every seven days, in contrast, decreased.
The proportion of households with washing machines showed the least variation. In 1920, 40% of the households had washing machines. With marginal increments by the year and a minor fall in the path, this figure had grown to be approximately 75% in 2019.
On the other hand, hardly anyone had a refrigerator in 1920, but the proportion of refrigerator owners increased sharply and consistently. Eventually, in 1980, every household possessed this cooling appliance, a fact that remained the same until 2019.
Furthermore, starting at 30% and ending at 100%, the trajectory of vacuum cleaners was similar to that of refrigerators. Subsequently, the weekly duration of the time spent on housework was on the decline. First, it more than halved from 50 hours (in 1920) to 20 hours (in 1960). Thereafter, it fell gradually and became nearly 10 hours at the end.

